Did COVID Erase My Endurance Gains?
Shortly after I published my last post, I got COVID. How much of my training progress did I lose?


Shortly after I published my last post, I got COVID.
The virus knocked me out for a full week, and even after I was “better,” I didn’t feel like myself. I was fatigued late in the day, and I had a very hard time getting out of bed in the morning.
I eventually returned to training, but my experience left me wondering: How much of my training progress did I lose?
In my last post, I identified an interesting metric that seemed to track my novice gains in endurance training: the amount of energy generated with each heartbeat, measured as watt-minutes per heartbeat.
Let’s look at that metric before and after my COVID break.
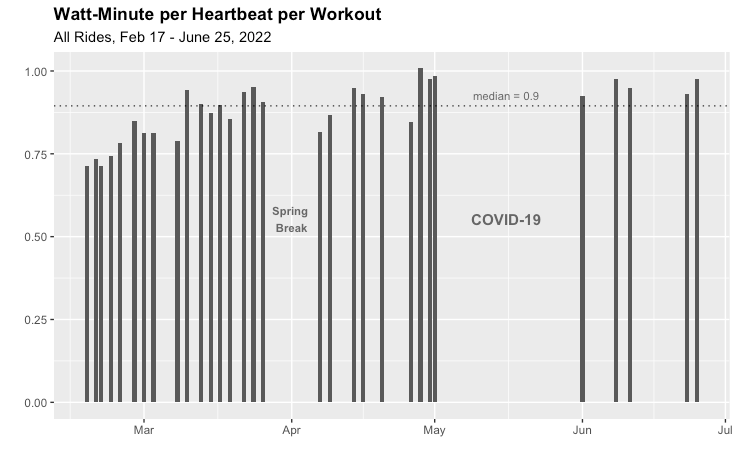
This looks like good news! My heart looks about as efficient at generating energy as it was before COVID. On the other hand, this metric seems suspiciously high. I certainly felt less fit than this chart would indicate.
Any time you are looking at a ratio, it pays to look at the numerator and denominator individually to see the full picture. (In a subscription app, for example, conversion—or sales efficiency—matters, but so does total sales.) So let’s look at the components of the above ratio: power and heart rate.
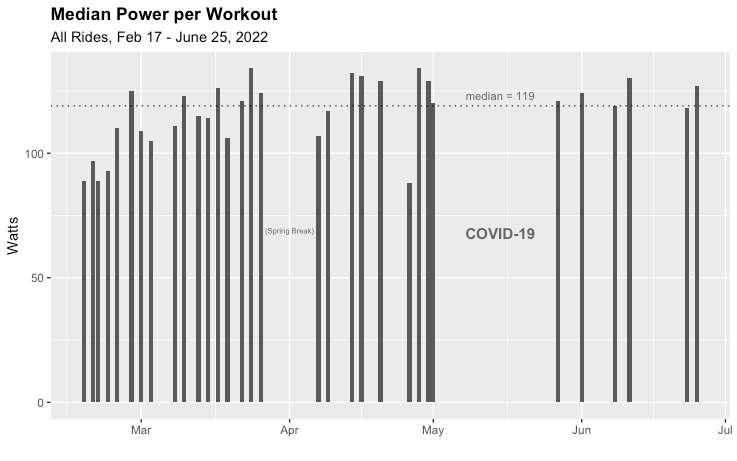
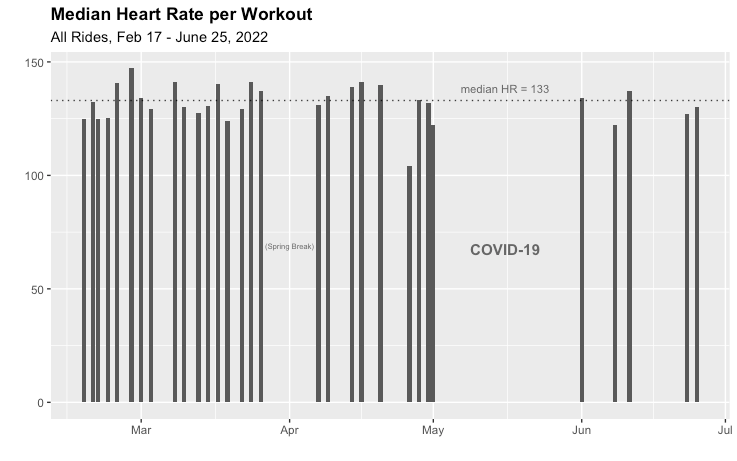
These graphs tell a broadly similar story as the ratio in the first graph. Heart rate is a little below average, while power at or slightly above average. This sheds some light on the ratio, but it’s not a “smoking gun” that points to an obvious loss of fitness. However, it’s important to note that both of these metrics (power and heart rate) are also ratios.
- Power is also a ratio of energy generated (or consumed) over time.
- Heart rate is a ratio of beats per minute.
So the missing piece of data—the missing denominator—is simply duration: How long were my rides?
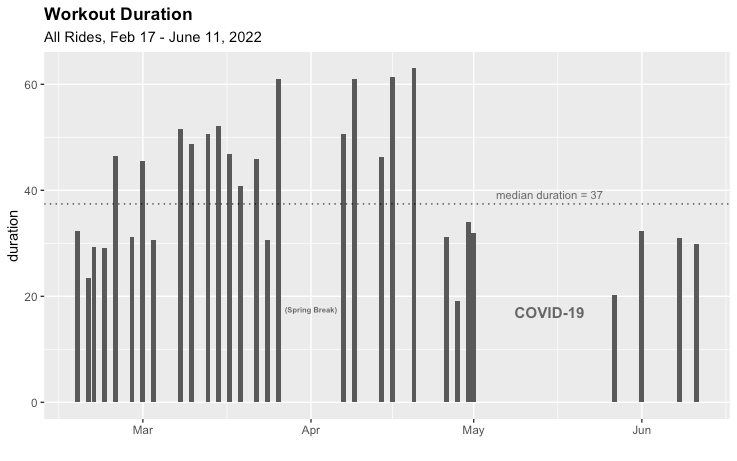
In fitness, the simplest data is often the most meaningful. My training is clearly not where it was in mid-April. There are two lessons here:
- Beware of focusing (exclusively) on ratios.
- Success in any domain is difficult to boil down to a single metric.
Pushing beyond these basic lessons, what is the theory of cardio fitness that explains the rapid increase in my watt-minutes per heartbeat early on, and yet also accounts for its apparent “stickiness” after COVID–when I would have expected a total reset? One theory is:
- Novice gains (measured with my original ratio of watt-minutes per heartbeat) can be “sticky”, persisting after an illness and gap in training.
- The “top end” of endurance can be lost more easily with a break in training.
We often discuss fitness as if “one size fits all.” The impact of training—or lack of training—is not universal, but depends on how advanced a particular athlete is. In my case, I’d say I’m “barely post-novice” as an endurance trainee.
Which makes the answer to the question posed in the title of this post a decisive “sort of.” COVID didn’t entirely erase my novice gains. But I clearly have some endurance rebuilding to do.